Node Monitoring
To ensure you have a seamless experience monitoring your node, we have developed a user-friendly Grafana Dashboard that enables you to easily keep track of primary metrics. Please follow the below steps to configure Grafana Dashboard for your node
Step 1: Get IP Address
Get the IP address of your machine or the cloud instance. To get your public IP you can run this command: curl ipinfo.io/ip

Step 2: Access Grafana
Access Grafana by entering this URL in your browser: http://<public_ip_address>:3100
Note: Please replace \<public_ip_address> with your machine or instance’ IP address.
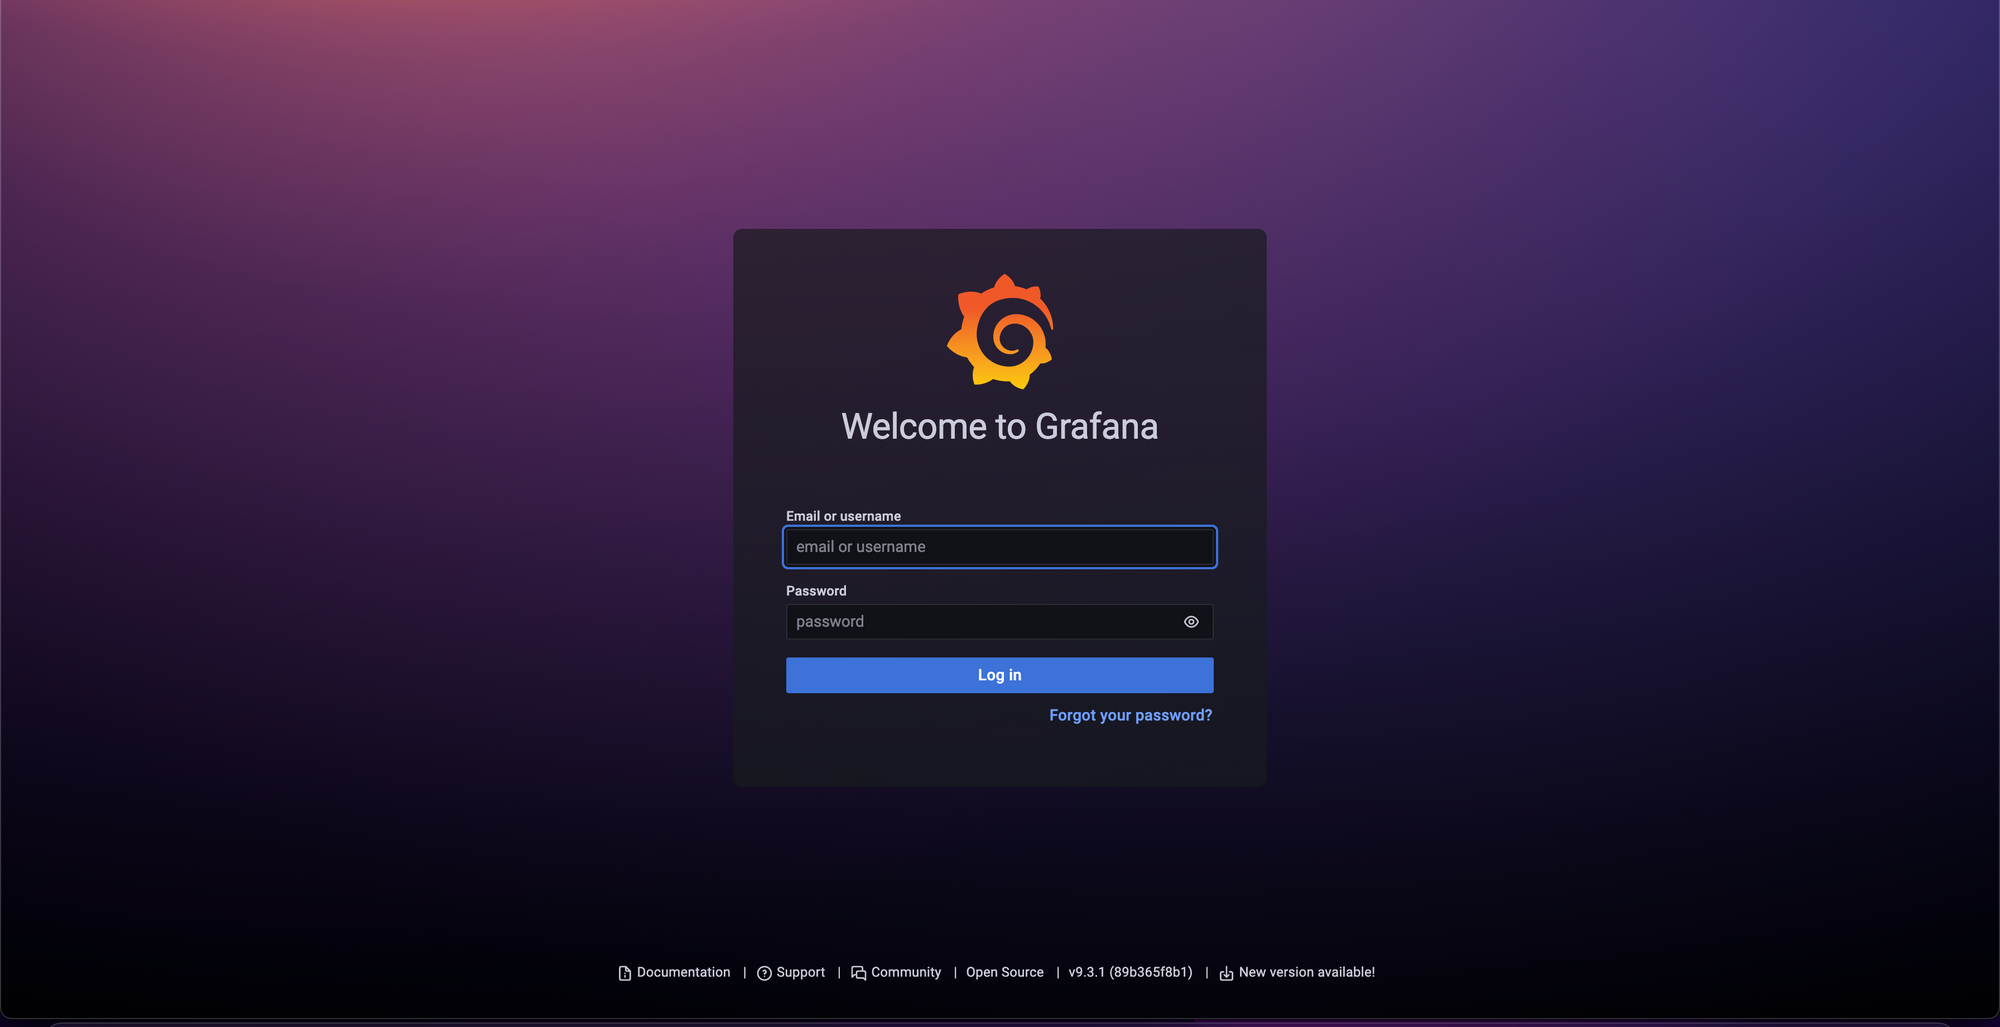
- You will see a login screen. The username and password is : admin
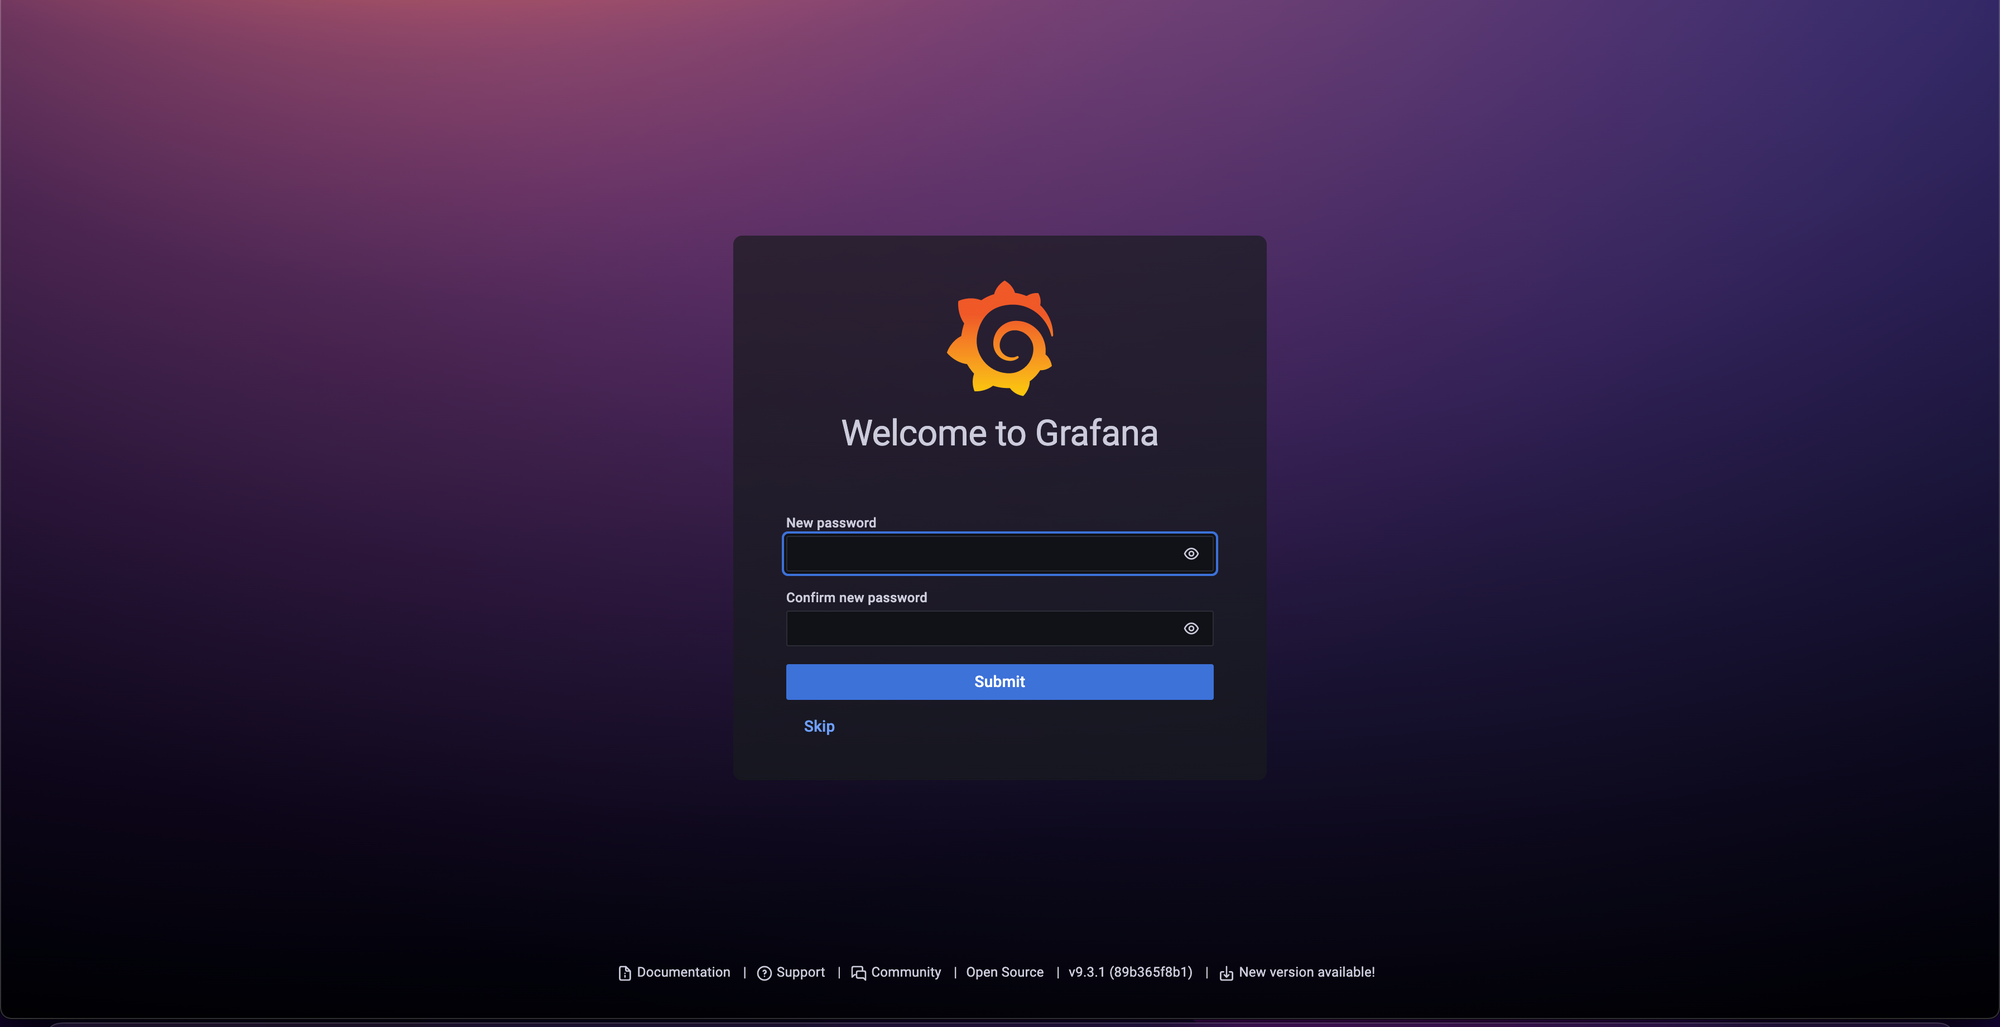
- You will be prompted to change your password. You can change it or skip it.
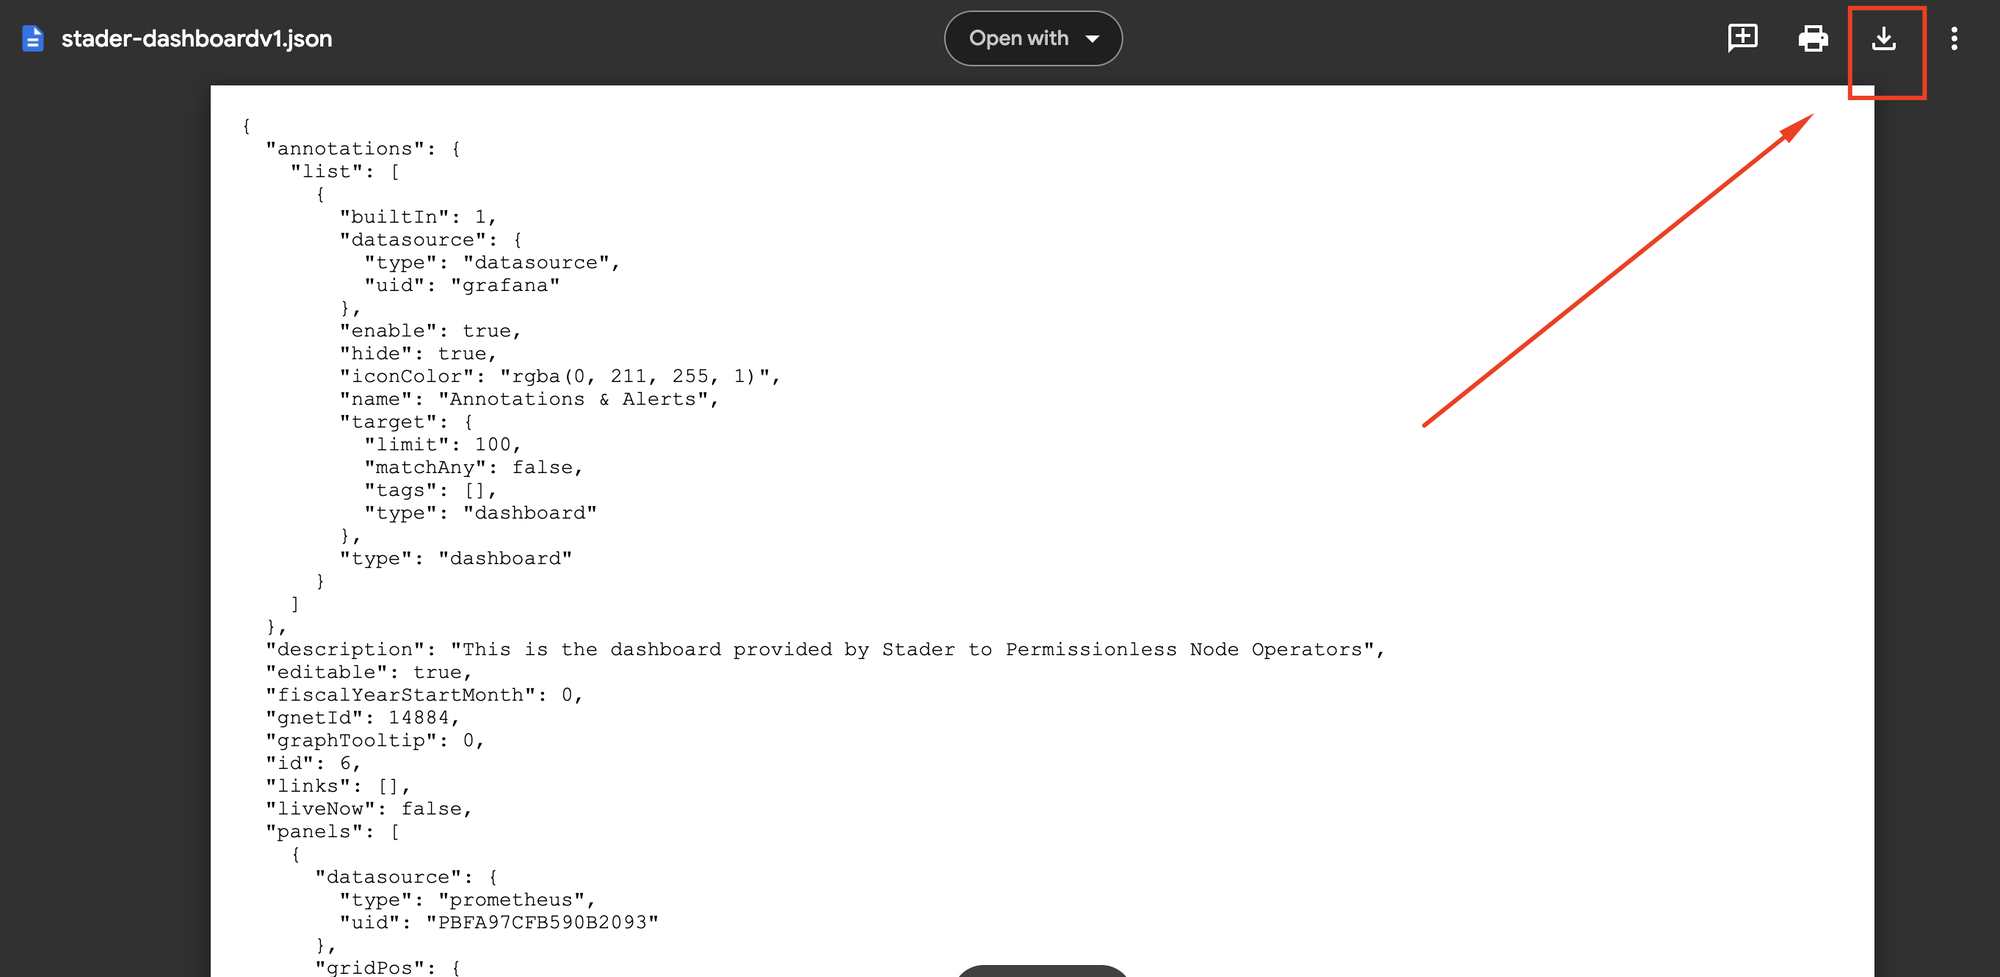
Step 3: Download JSON
Click here to download the Stader node Dashboard JSON file
Step 4: Import the Grafana dashboard
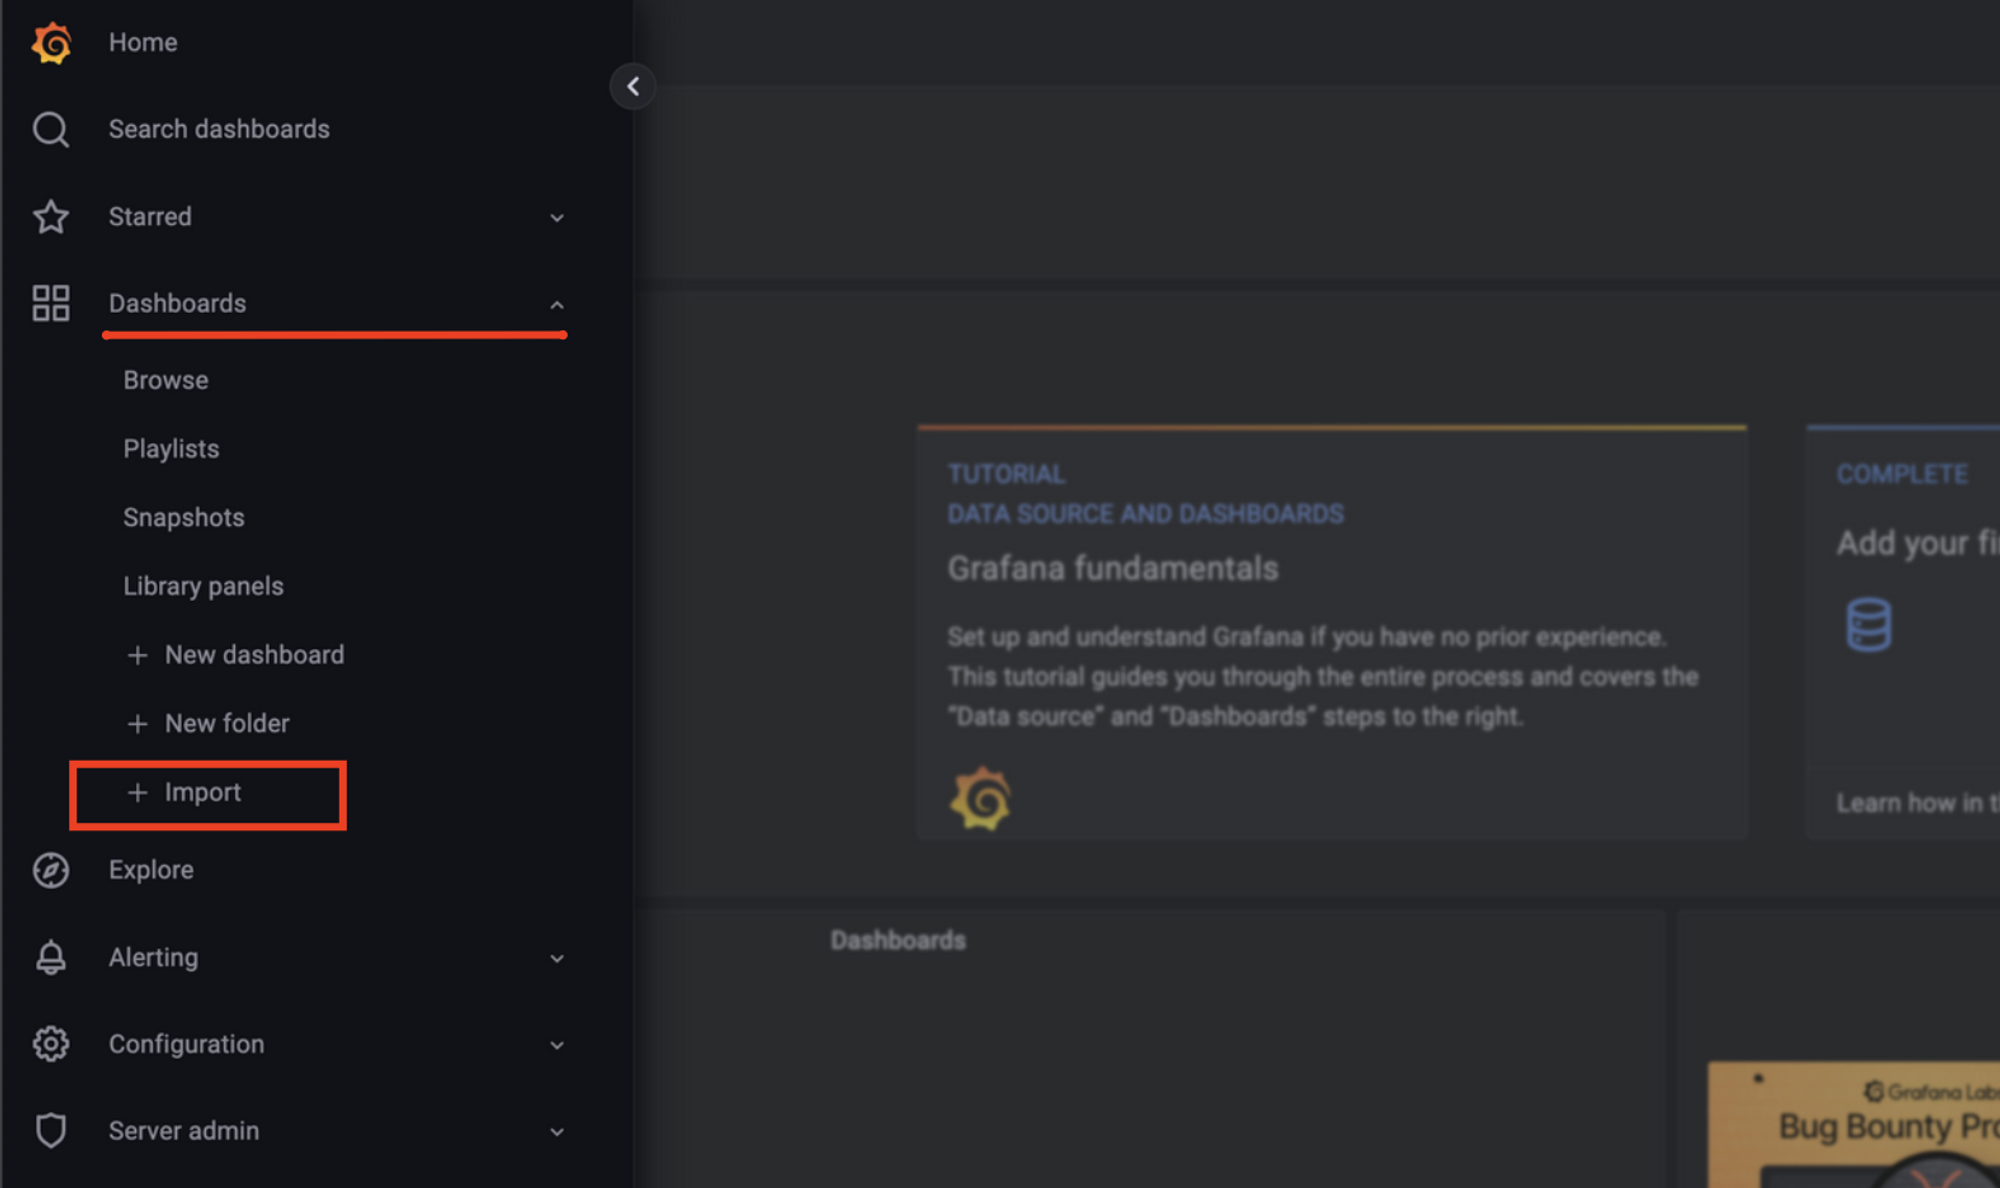
- On the left panel, click on Import under Dashboards
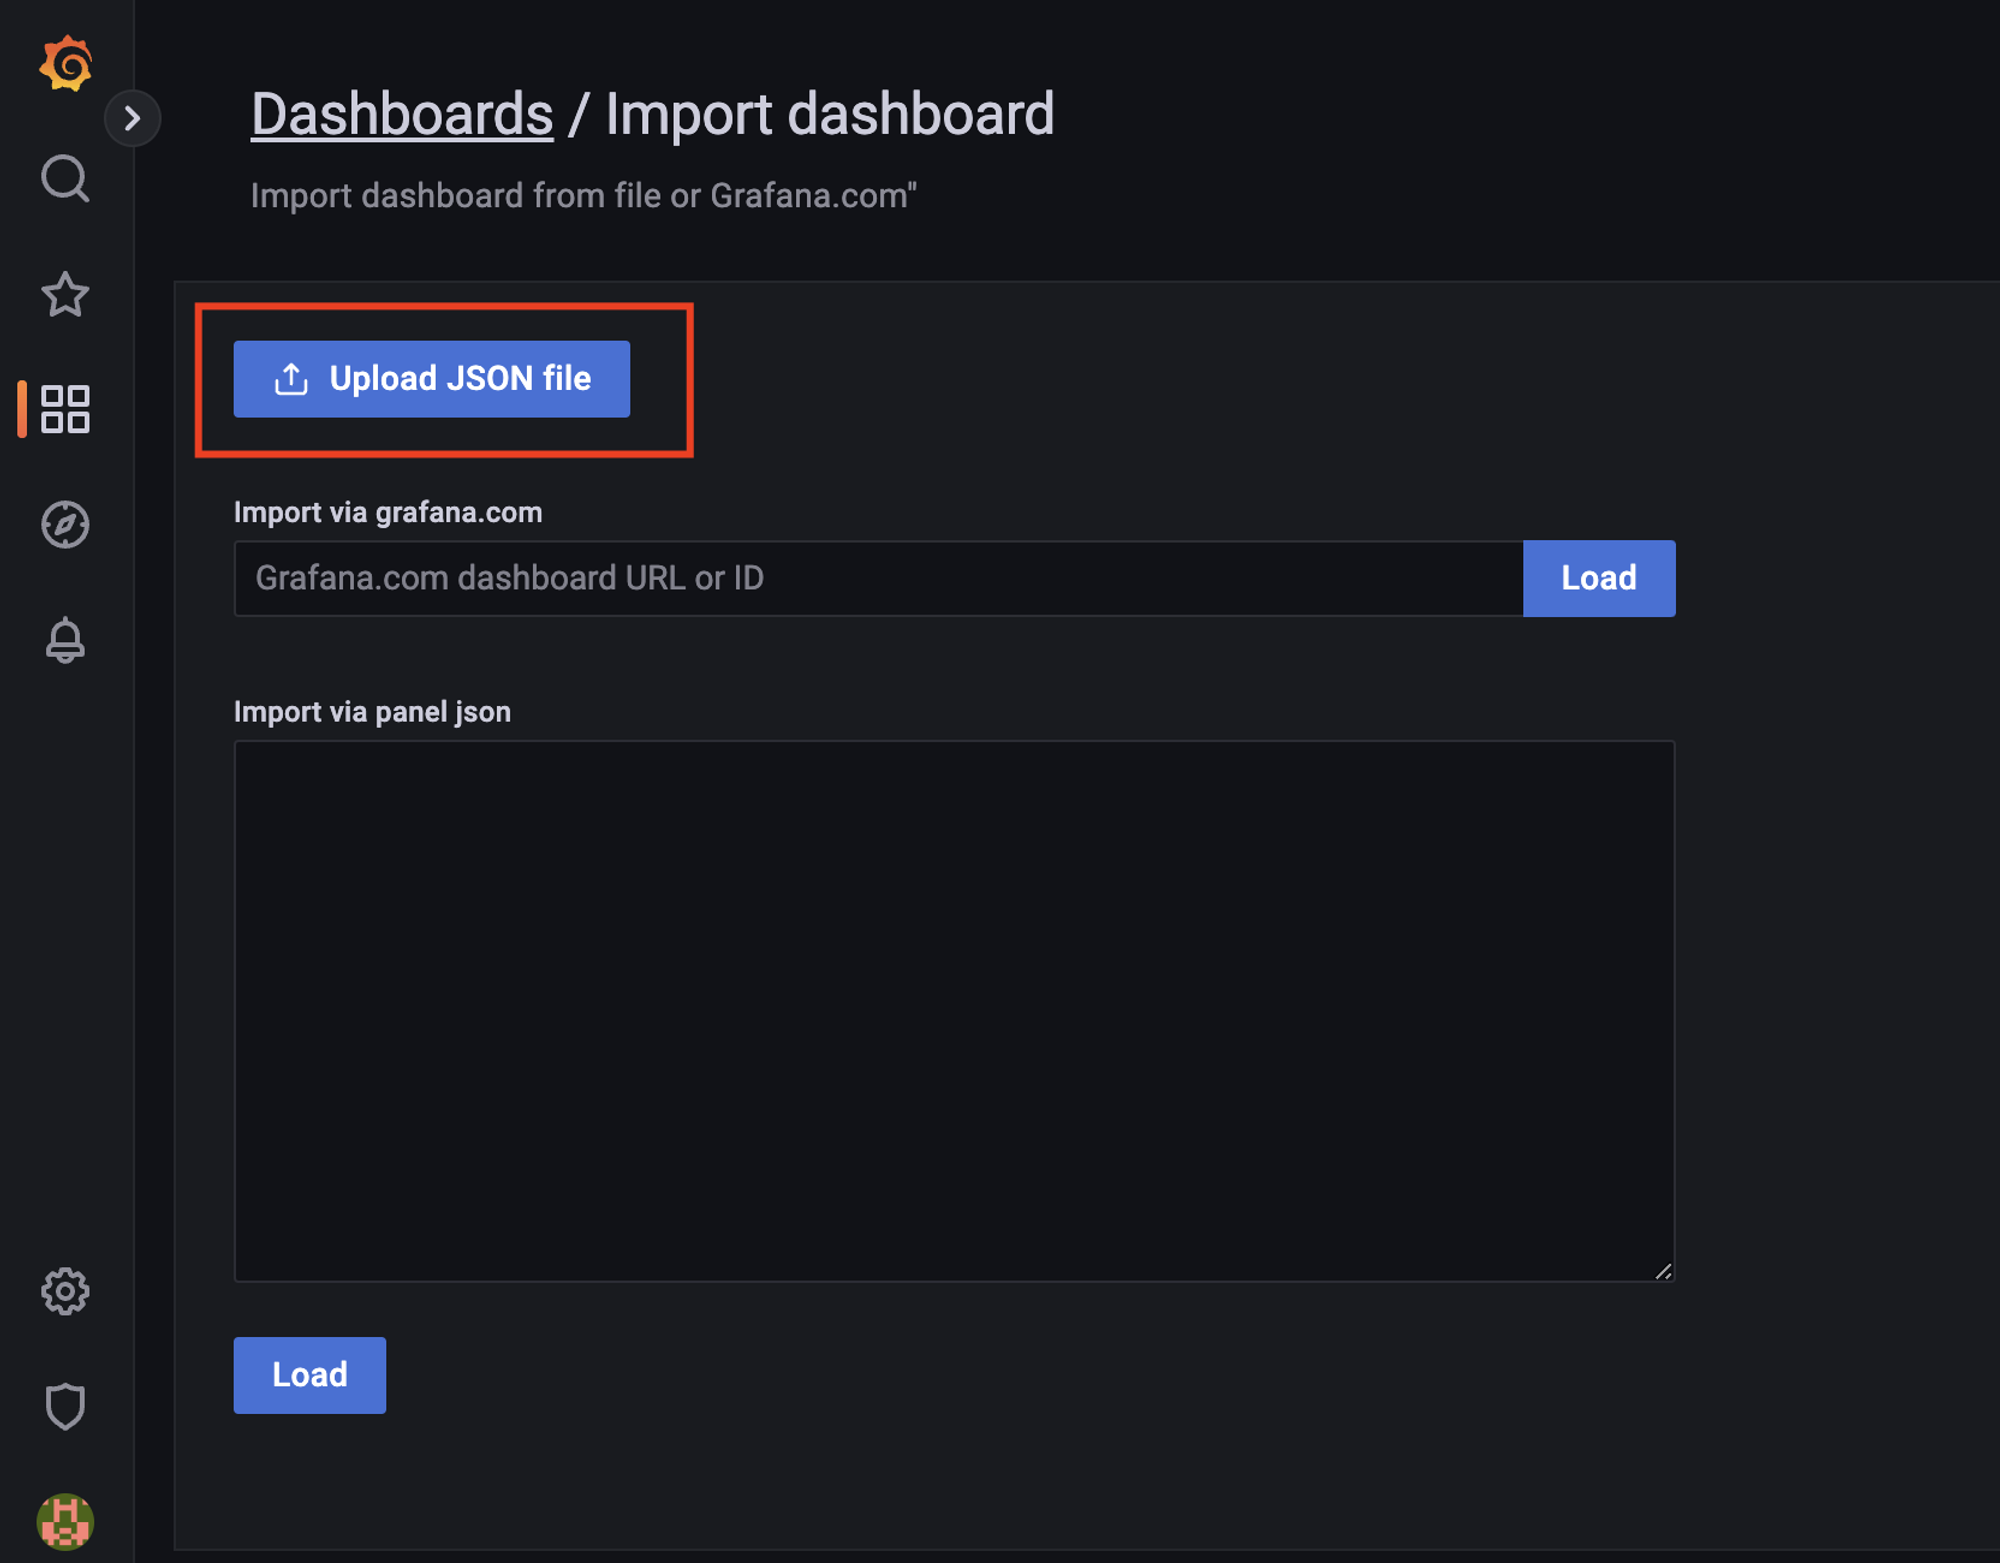
- Upload the JSON file you downloaded in Step 3 by clicking on the “Upload JSON file” CTA
- Click on the Import CTA
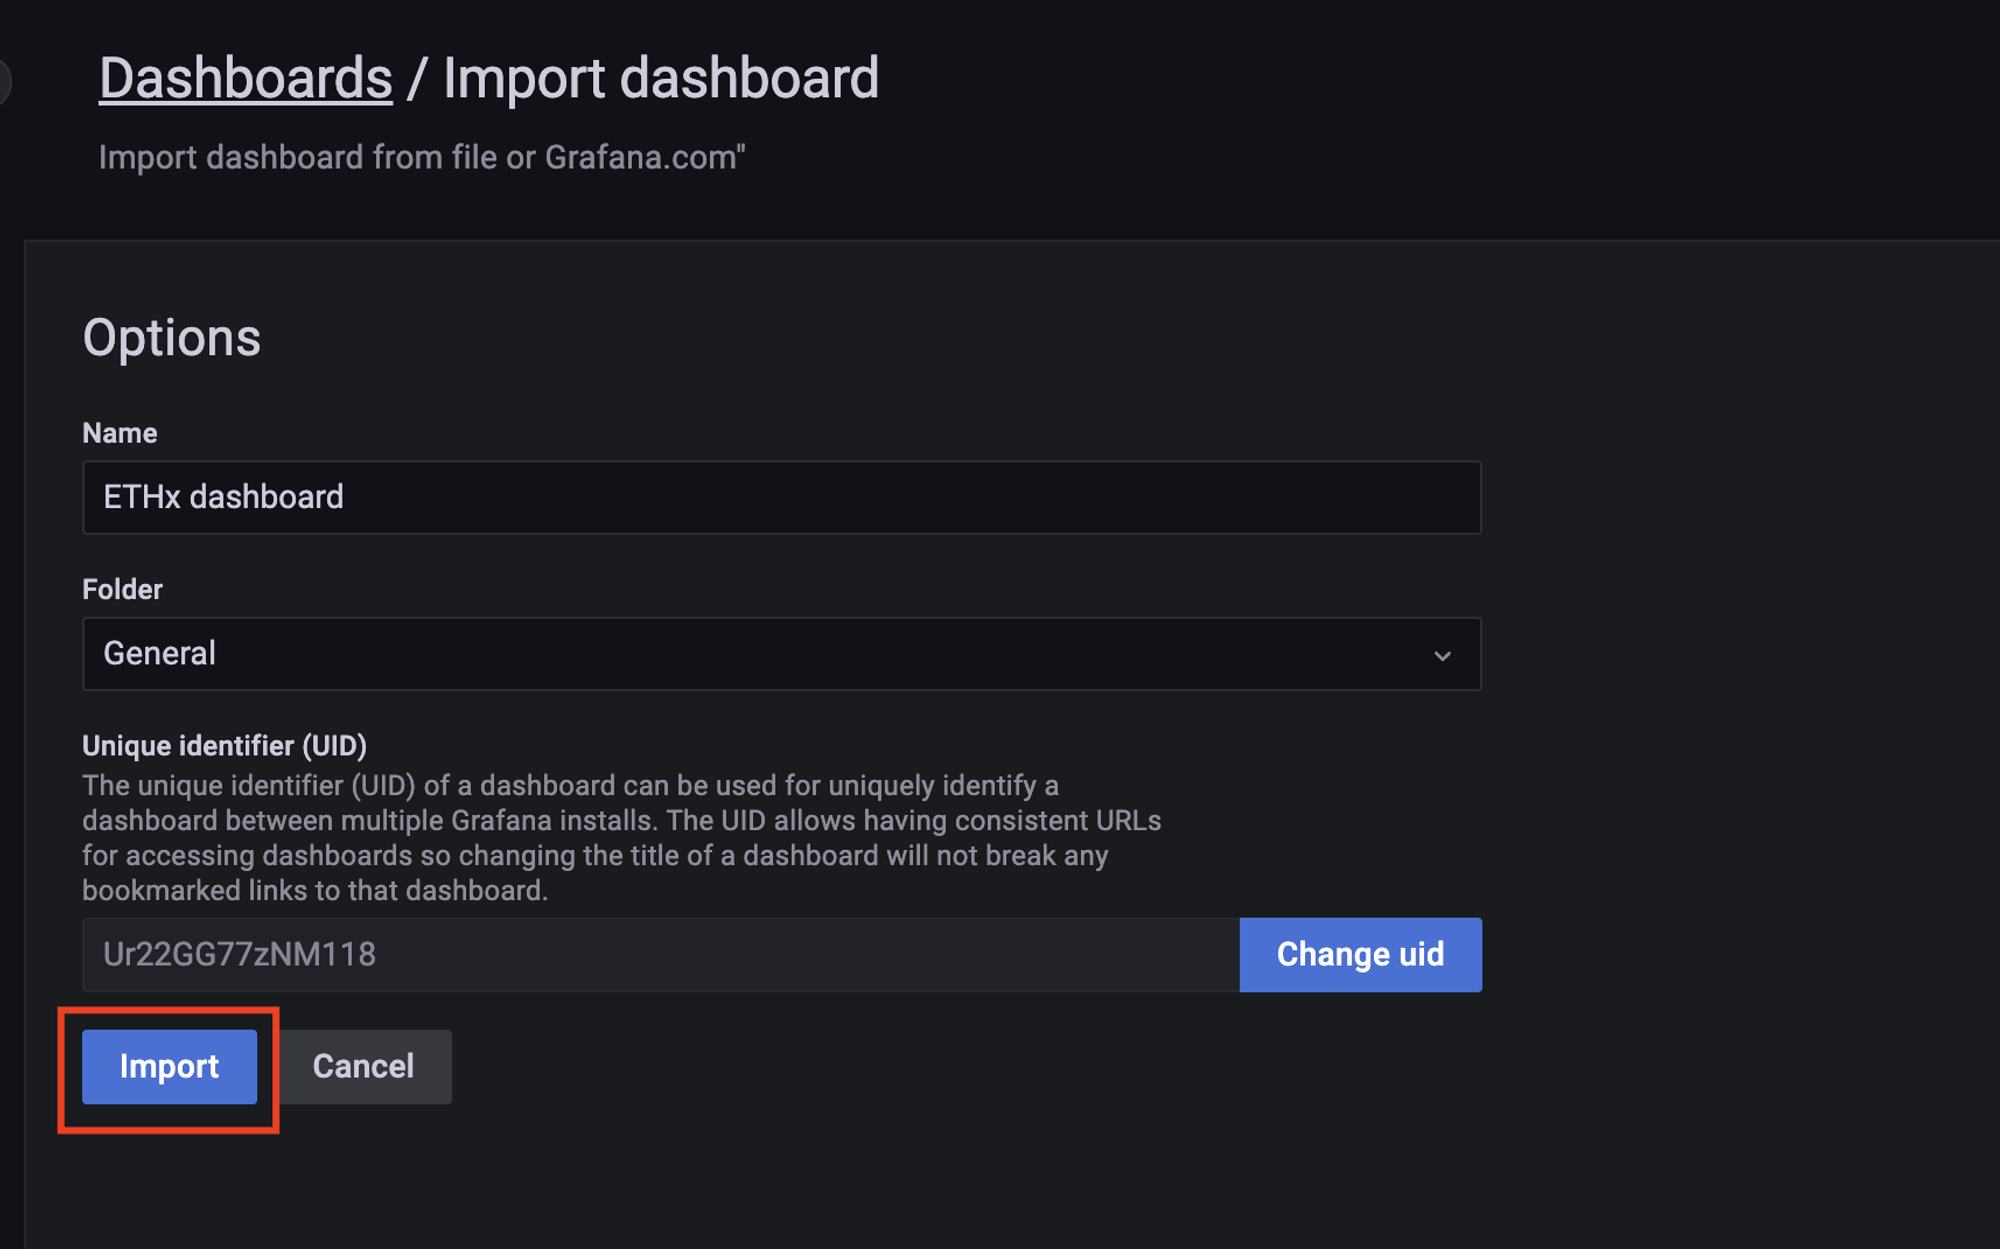
Note: If you see an error saying that the dashboard id has already been taken, just edit the id to some random value by clicking on the “Change uid” button and it should work.